This is my first blog post I'm writing here not in german. I know that most users who are interested in this post will want to read it in English.
With Plesk Obsidian there is a new monitoring solution in place for Plesk, as an extension, called "Advanced Monitoring". This is based on Grafana. The old "System monitoring" extension isn't removed completely. The metrics from the old extension are now the source for the Grafana extension.
If you have a couple of Plesk servers running, now each plesk instance has it's own Grafana. If you need statistics about your systems, you have to go to each server, login, and visit Grafana for a view on the dashboards. Ugly? So why not run a master Grafana instance for monitoring all servers on one place. The data are always there, and historical data are available from the point you have started using the monitoring extension for the first time. You have to do 3 steps to have a centralized Grafana Monitoring Dashboard for your Plesk Stack:
1. Install Grafana
I do not want to go deep in the process in installing Grafana. If you are running multiple plesk servers, you know how to do. You can run Grafana on a subdomain of your company website, on AWS, DigitalOcean, etc. My way was to run the Grafana/Grafana Docker image at the master server. If you run Grafana on docker, you must configure some extra paramaters for email settings and, very important: volume mapping of the data directory. If have mapped the data directory to the data dir of the subdomaion where the monitoring ist running, this gives me the chance to include all Grafana settings and dashboards into the backup of this system. Find your way how you would run Grafana.
To access the metrics generated by the plesk monitoring system we need to add an additional "Datasource" to Grafana. You have to install the Simple JSON Datasource Plugin. Add this Plugin to your Grafana instance by the required way. If you are on docker you have to add:
GF_INSTALL_PLUGINS=grafana-simple-json-datasource
2. Find the metrics endpoint
The metrics that collects Plesk are available in the JSON format. The URI for connecting Grafana to your Plesk servers data is very simple. We need to GET the data from the monitoring module which is running inside Plesk and provides an public endpoint. Access is secured by an authorization token. The endpoint is available via http and https on the default Plesk ports. Example:
http://your.server.hostname:8880/modules/monitoring/public/index.php/AUTH_TOKEN
https://your.server.hostname:8443/modules/monitoring/public/index.php/AUTH_TOKEN
The URI for the endpoint you can build on the simplest way: use your Plesk Hostname or IP. The AUTH_TOKEN is stored on the Plesk database (psa). The long way is: enable grafana admin, login as admin, examine the JSON datasource and find the auth token.
The easy way ist to ask the psa database directly, the plesk guys gives us the easy way with the Plesk CLI tools. Login to your server by ssh and use this command:
# plesk db "Select value from ModuleSettings Where name = 'rrd_api_auth_token'"
The Output you will get looks like:
root@plesk:~# plesk db "Select value from ModuleSettings Where name = 'rrd_api_auth_token'"
 +------------------------------------------+
 | value                                    |
 +------------------------------------------+
 | Efzh21TXBbleDVcxxxxxxxxxxxxxxxxxxxxxxxxx |
 +------------------------------------------+
Now you have found the needed AUTH_TOKEN that you have to use ath the end of the endpoint URI for the JSON datasource. If you open this Link with yopur browser you will see nothing, but this is correct. If you get an access denied error, something is wrong with the URI.
3. Add the datasource to Grafana
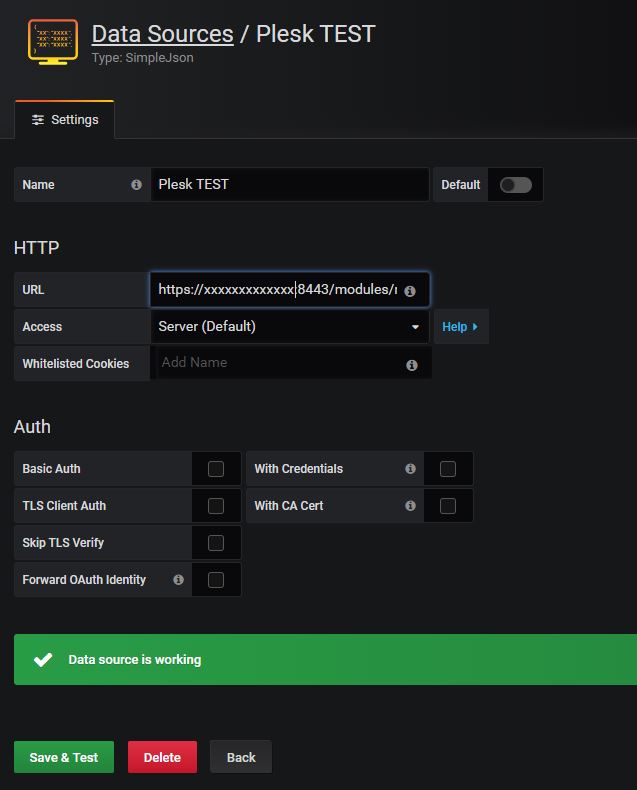
On your Grafana installation got to Configuration > Data Sources and click on Add data source.
On the next screen for the type of the data sources you can find the "SimpleJSON" type at the end of the page under "Others". Click on it.
We need only 2 settings: Enter the Name of the datasource (server) and the URL to the generated endpoint. It's important that "Data source is working is shown if you click on Save & Test.
You can now create a new dashboard for your servers at a central place. You can still use the "Advanved Monitoring Grafana" on your plesk servers directly, also to get some ideas in how to build your own Dashboard. You have to add a datasource for each of your servers on the same way.
Note that data from the datasource are not available directly after you have added the source to your Grafana installation. It can take some time if you can select the metrics!
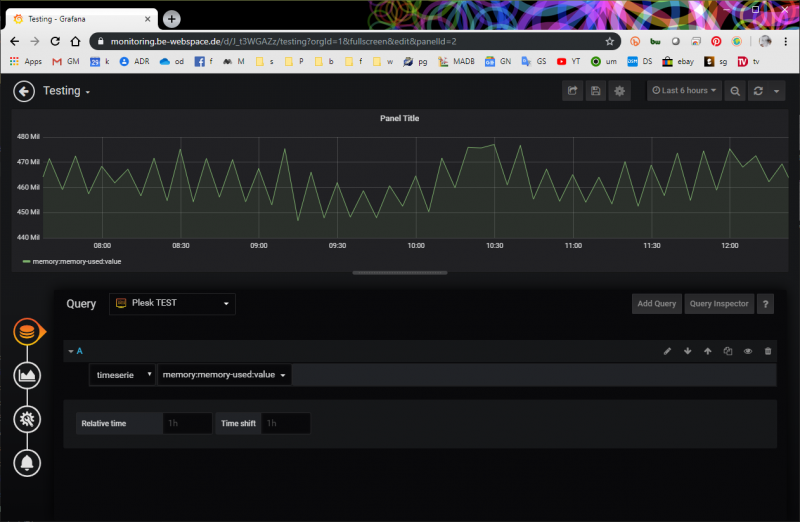
Metrics are provided as default timeseries data, it is very simple to add graphs and statistics to your dashboard. This is an example to get a fast idea in how to add data to a Dashboard:
Add a new query, Select the JSON datasource from a server and select the the needed metrics in the "select metric" dropdown. That's it.
This is the easy way for adding Plesk metrics to a centralized Grafana dashboard. Maybee now it's the right time for learning more about Grafana, there are tons of options how you can improve your monitoring system with Grafana. You can do many more things than monitoring Plesk servers.
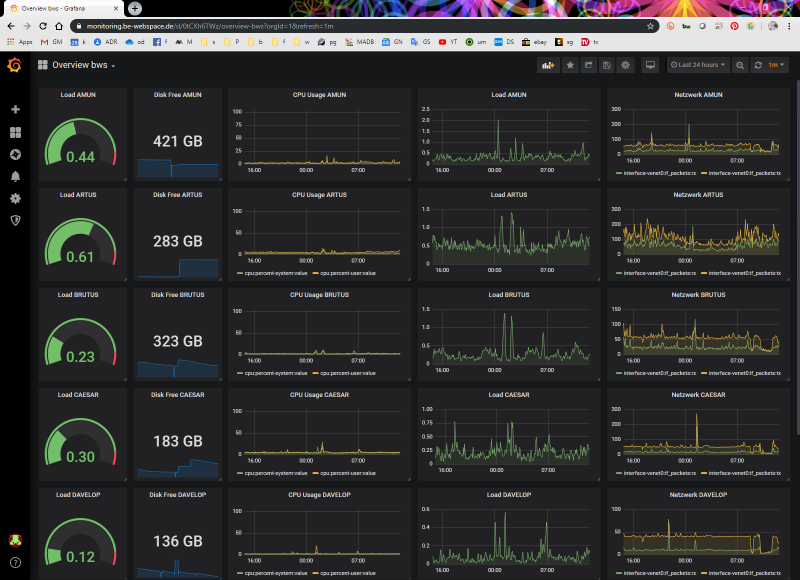
Grafana Plesk Dashboard Example
Update 2024
Da sich seit 2019 einiges geändert hat: den Token findet ihr jetzt via SSH mit diesem Befehl:
sqlite3 /usr/local/psa/var/modules/monitoring/monitoring.sqlite3 "SELECT value FROM params WHERE name = 'rrd_api_auth_token'"
Hi,
Thanks for the nice and compact inscription. I following your main steps and reaching at end point configuration I get the “ Can not GET file “ error
https://your.server.hostname:8443/modules/monitoring/public/index.php/AUTH_TOKEN
however, I can’t locate the whole path after the port… Any Hints Where could I get the path to the file on a Linux system?
thanks for the answer.
You dont need to change the path. This path is aways like described here. You only have to get your own Token!
Thanks Powie for the reply,
then how do I add or set AUTH_TOKEN to the file index.php ?
is the path ../index.php/AUTH_TOKEN or => ../index.php?AUTH_TOKEN
However in my case both return „HTTP Error Not Found“
Hi,
just wanted to say thanks for the wonderful walk through and also add where I was hanging at for someone who might run into the same problem:
+ My Problem was that there was a CORS Policy + Firewall policy at my source server in Place and it was refusing the connection.
How did you get the disk space free one?
Hi,
This looks very promising!!! However, I tested it under Plesk Obsidian and the „plesk db“ query returned no results.
plesk db „Select value from ModuleSettings Where name = ‚rrd_api_auth_token'“
Has anybody successfully implemented this on Plesk Obsidian?
Thanks!
We are runnig this on obsidian. Grafana Extension is installed?
Would you share your Dashboard with us also? 🙂
yes contact me directly
How do you migrate from SimpleJSON to the new Infinity Datasource plugin?